Radiation in flight
Experimenting with an inexpensive Geiger counter at altitude.
I recently got a (relatively cheap) Geiger counter as a gift. I read that granite rocks can contain trace uranium, so I took it to some granite boulders, but didn’t measure anything above background. The most common isotope of natural uranium is uranium-238, with a half-life of about 4.5 billion years. When a U-238 nucleus eventually decays, it emits an alpha particle: two protons and two neutrons. Alpha particles are easy to stop. Most alpha particles produced inside the granite are stopped by the rock itself. Alpha particles produced close enough to the surface to escape would probably be stopped anyway by the plastic case or the glass cylinder in my Geiger counter.
That glass cylinder is a Geiger–Müller tube: a tube filled with gas waiting for ionizing radiation to knock electrons off atoms in the gas. That then triggers a cascade that produces an electrical pulse that can be counted. Alpha-sensitive Geiger counters use a very thin window, often made of mica, so alpha particles can enter the tube before being stopped. Mine is the cheap glass-tube kind, its manual lists beta, gamma, and X-ray, not alpha detection.
I took it on my next flight, and displayed dose rate did go up substantially above background radiation levels. It went from ~0.3 µSv/h to ~2.5 µSv/h. To put that in context, check out this classic xkcd post. Note however that aside from not picking up on alpha particles, my Geiger counter also doesn’t detect neutrons. Those are penetrating enough to pass through the glass of the tube, but since they are not charged particles, they won’t knock electrons off the atoms of the gas. And it turns out, neutrons are a big part of the radiation we get while flying, or so I’ve read! So, ~2.5 µSv/h is an underestimate.
Anyway, here’s the plot of (displayed) radiation1 dose rate vs.
altitude. I document below how I got the data and used an LLM/agent to plot it.
Output looks sensible, but I haven’t spent the time to check it’s actually
correct. 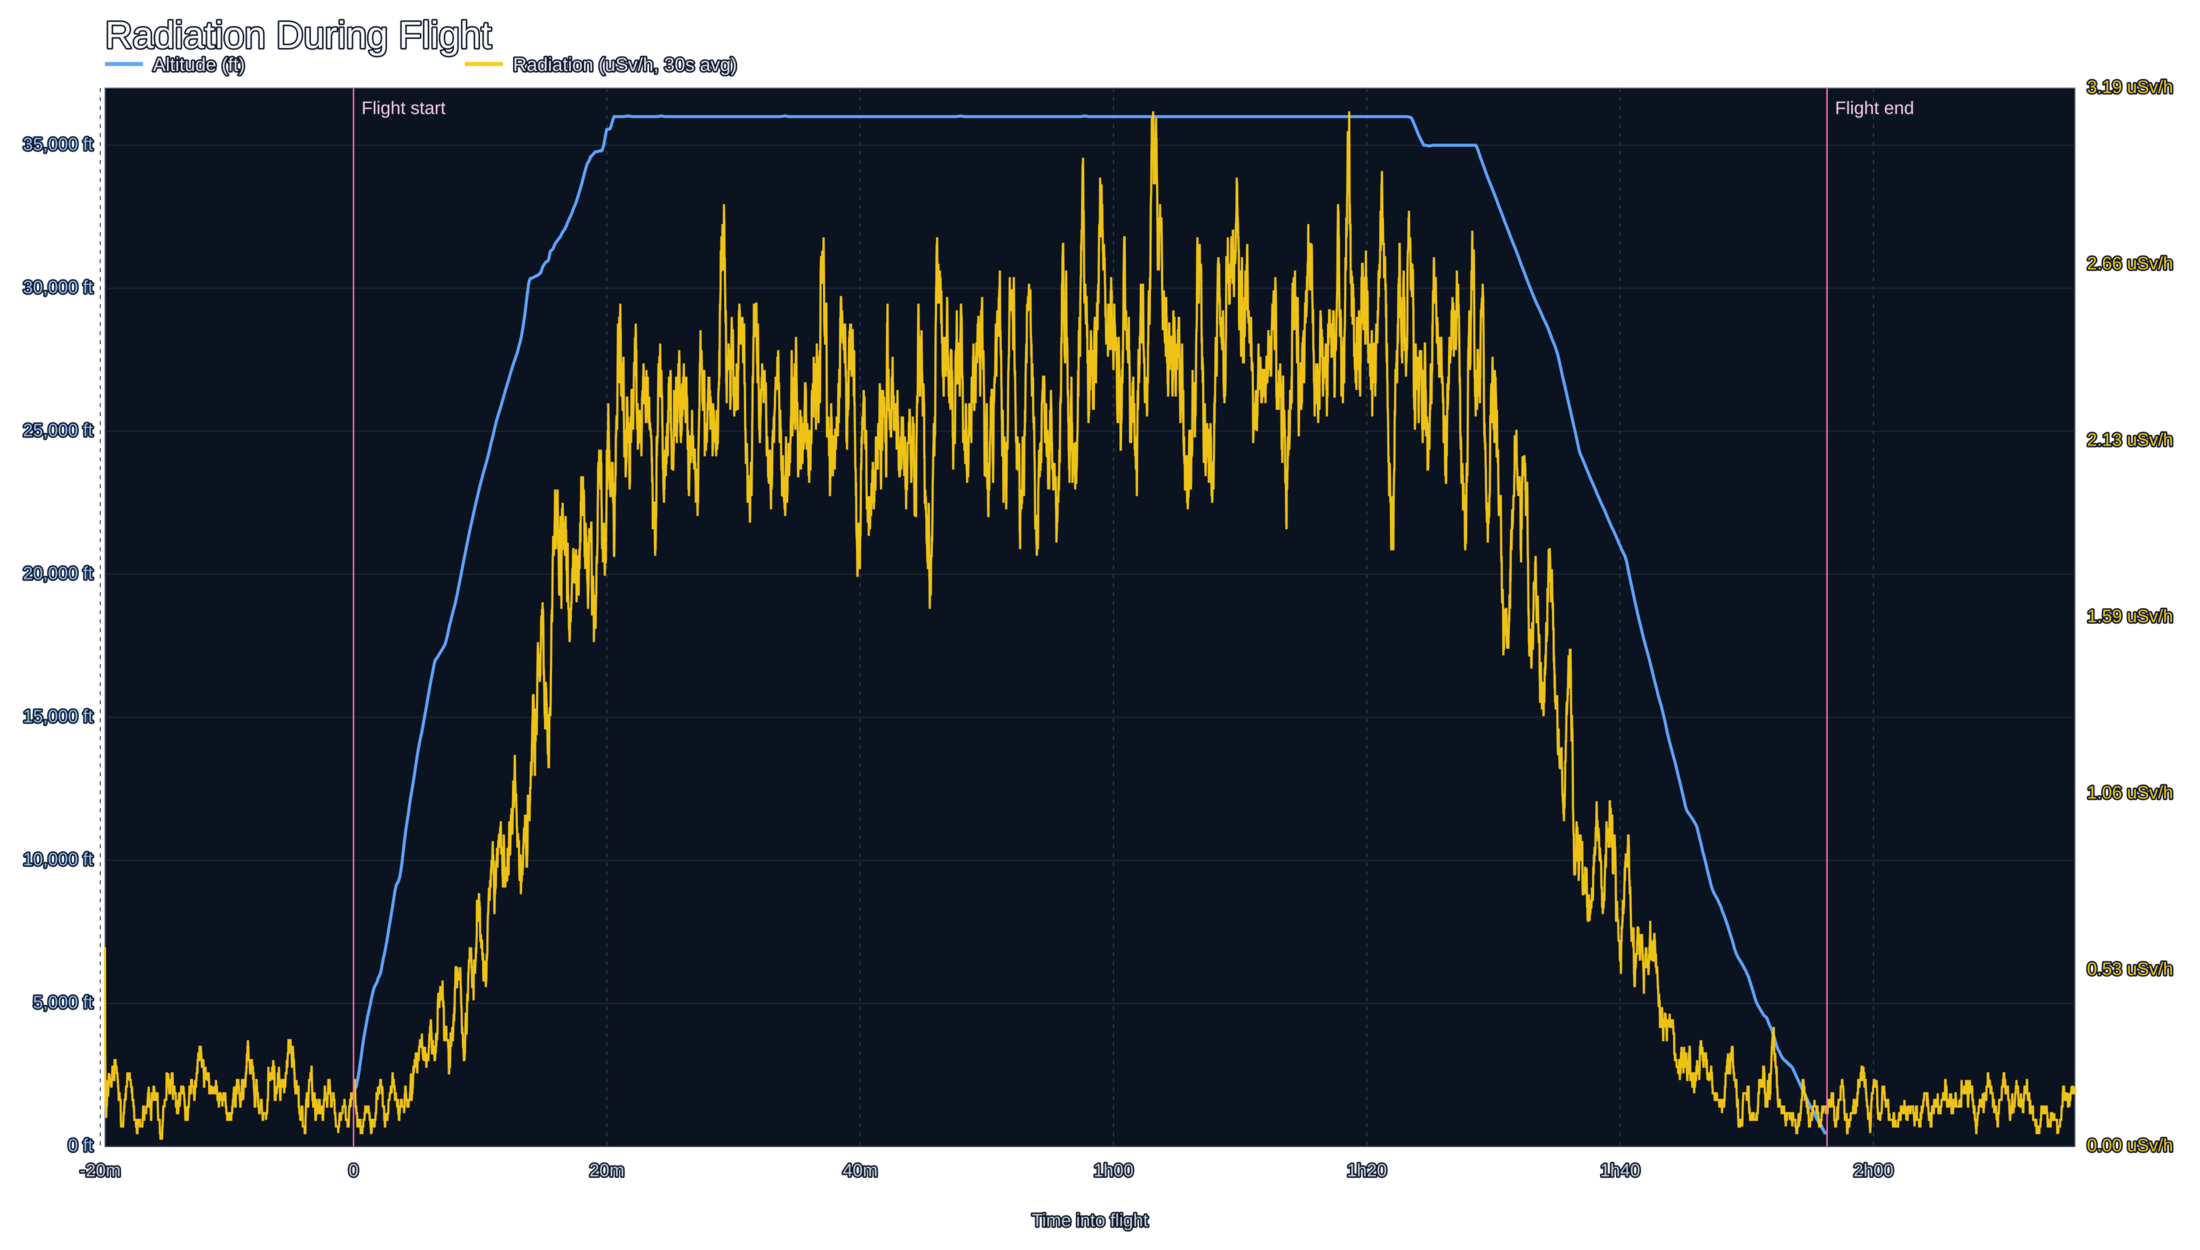
Unrelated to this, for the last couple of years I was under the impression that flying at night would mean less radiation. I thought the Sun was the main source of radiation if flying during daylight hours. But that’s not really true and most radiation while in flight is more likely to come from outer space.
Although I guess solar events could change that. The Sun goes through an 11-year cycle from solar minimum to maximum. During maximum the Sun has more sunspots, solar flares, etc. – more sparkly! The magnetic field of the Sun actually flips around in this cycle, too. IIUC, all of this is because the Sun is a messy mass of rotating plasma, with parts moving around at different speeds, and the resulting convection, stretching, twists, etc. translate into this apparent cycle.
Right now (2026) we are likely just somewhat past a solar maximum, which should mean we are more likely to get high-energy particles thrown our way from the Sun. It also means that fewer galactic cosmic rays reach us due to the Sun’s heliosphere at that time – a huge bubble of the Sun’s magnetic influence fueled by solar wind (charged particles flowing out of the Sun).
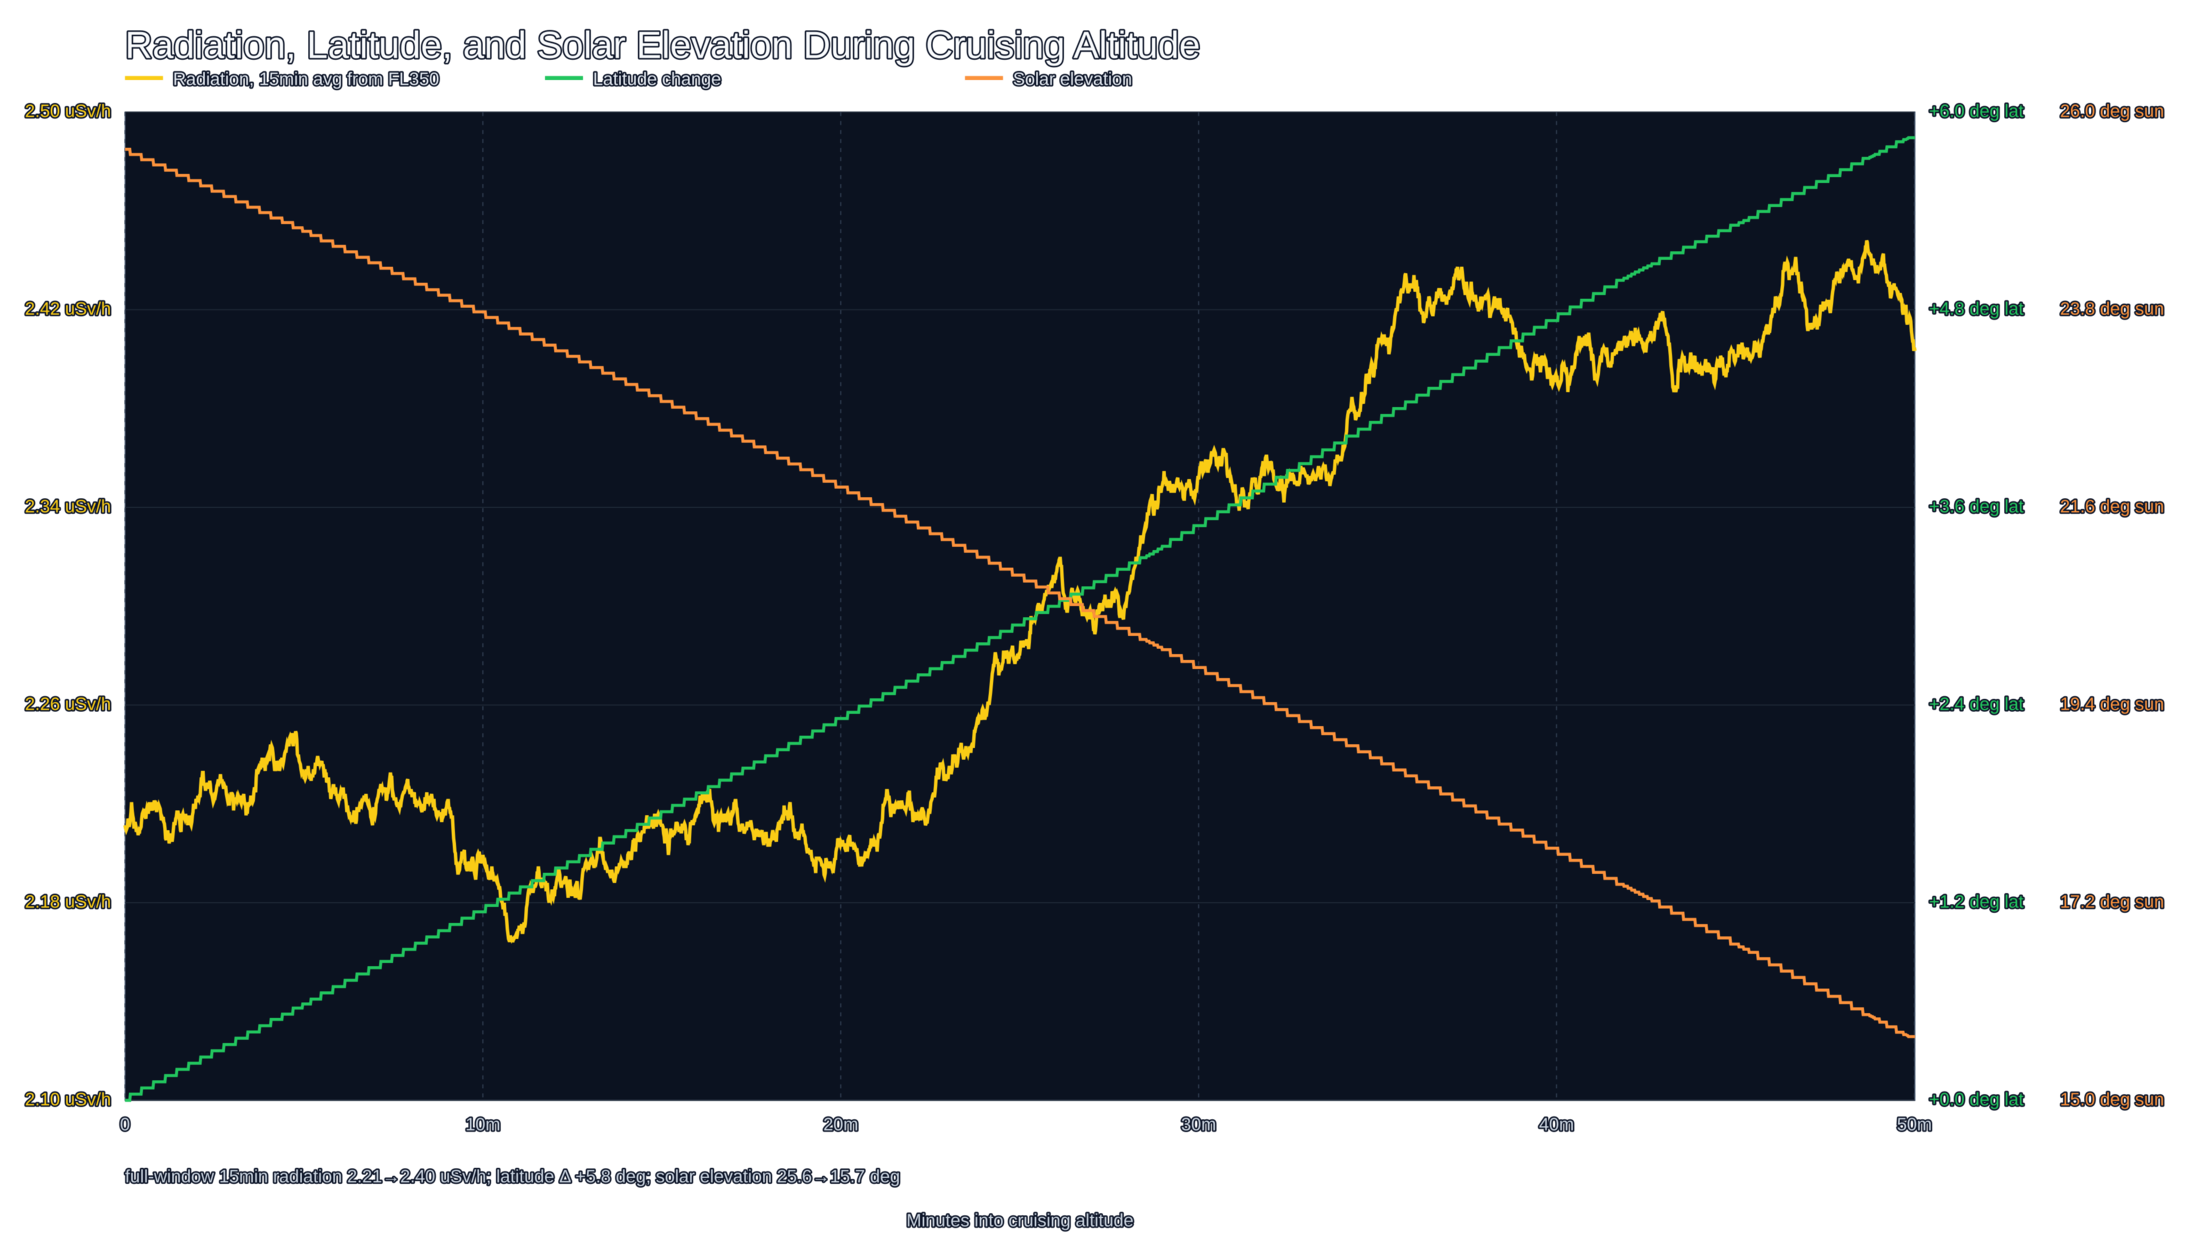
In the plot above (radiation vs altitude), there’s a bit of an upward trend at cruising altitude. I got curious, so I asked codex to plot latitude (it’s in the flight ADS-B data too), and solar angle (not in ADS-B, but it can figure it out given time and coordinates which are in the flight data). To make the trend clearer, I asked for a 15-minute moving average. I was flying north. This very weakly supports the theory that radiation while in flight is probably not mostly due to the Sun. Of course, this is just one flight and during daylight, with a limited Geiger counter, etc. Also “solar angle” is not a good proxy for how exposed we’d be to solar particles, magnetic fields change that. And geomagnetic latitude would have been better. Essentially, as scientific as lukewarm snake oil baths. Just having some fun with a Geiger counter and codex. It is however what the FAA seems to say too: “principally from galactic cosmic radiation”.
NASA says/estimates [cite] that the average age of cosmic rays is ~10 million years. Humans were not a thing on Earth at that time!
Apparently most of the ionizing particles that end up hitting the plane are “secondary particles”. Meaning that they are the result of cosmic rays hitting the upper atmosphere, interacting with the atoms there, and producing showers of particles below.
Some of those particles are called muons. They have a mean lifetime of about 2.2 microseconds at rest. 2.2 microseconds at 0.999c (non-relativistic) is around 660 meters, not enough for them to even reach a high-flying SR-71. But due to special relativity (apparently – I know next to nothing about physicsm, sadly!), in our frame of reference, a muon’s clock is ticking a lot slower relative to ours, and distance is contracted from their frame of reference. So, many do reach our flying aluminum cylinders, or even the ground. NASA has some cool diagrams about this.
Analyzing with an LLM/Agent
I simply used an agent to write the code needed to parse the data and generate plots. The amount of time it would’ve taken me to learn the right libraries to use, tweak the right parameters, etc. to generate exactly the plots I wanted would probably have meant I never would’ve had the time, let alone the convenience of quickly iterating through different plots, etc. Hm… I keep finding myself in the position of having to justify my use of LLMs. Maybe that rumination can go into a different post I guess.
But, I do think understanding what data goes into the LLM, at least, can be a good idea to judge if it would actually be possible to generate results.
It’s very likely I could’ve let my agent do that part for me as well. Just tell it “I was on flight XYZ around that evening, get the flight data, I’ve plugged in the counter, here are some pictures to sync counter time, make some pretty plots, go”. But maybe it’s not a bad idea for me to have “in my context” some of the process, for… maybe one day. Or.. ah, I don’t think we know.
Data
Geiger counter radiation data
I used something like this – h/t pygmc.
#!/usr/bin/env python
# $ uv pip install pygmc==0.14.1 pandas
import pygmc
import pandas as pd

gc = pygmc.GMC800("/dev/ttyUSB0")
history = gc.get_history_data()
df = pd.DataFrame(history[1:], columns=history[0])
df.to_csv("exported_gmc800.csv", index=False)
And data looked something like this
datetime,count,unit,mode,reference_datetime,notes
2006-01-02 04:01:33,0,CPS,every second,2006-01-02 04:01:32,
2006-01-02 04:01:34,1,CPS,every second,2006-01-02 04:01:32,
2006-01-02 04:01:35,0,CPS,every second,2006-01-02 04:01:32,
Flight data (ADS-B)
In the past, when I’ve played around with flight data, I’ve used FlightRadar24 or FlightAware. Unfortunately it looks like their terms of service would not technically allow me to make a public blog post using their data. I don’t think they would care, but just in case and because there seems to be an easy alternative, I’ll use ADSB.lol instead. They publish open (ODbL 1.0) daily ADS-B history dumps, including for 2026. This month’s data seems to be under GitHub releases.
Last Spirit Airlines flight example
To see what getting data from ADSB.lol would look like,
let’s explore what appears to be Spirit Airlines’ last
flight
– “Spirit 1833”, also known as NK1833. NK is the
IATA
airline code, while NKS is the
ICAO
airline code. In the ADS-B trace data, the flight shows up as NKS1833. The
IATA code seems to be used for tickets, airport displays, and other passenger-facing
stuff. For air traffic control, ICAO seems to be the one to use.
Anyway, for that day (2026-05-02), we can just download the two release parts, concatenate and unpack the tarball.
mkdir adbs-spirit-flight ; cd adbs-spirit-flight
curl -fLO https://github.com/adsblol/globe_history_2026/releases/download/v2026.05.02-planes-readsb-prod-0/v2026.05.02-planes-readsb-prod-0.tar.aa
curl -fLO https://github.com/adsblol/globe_history_2026/releases/download/v2026.05.02-planes-readsb-prod-0/v2026.05.02-planes-readsb-prod-0.tar.ab
cat v2026.05.02-planes-readsb-prod-0.tar.aa v2026.05.02-planes-readsb-prod-0.tar.ab > v2026.05.02-planes-readsb-prod-0.tar
tar xvf v2026.05.02-planes-readsb-prod-0.tar
The trace data (traces/ dir) is indexed by aircraft registration number – an
aircraft’s license plate. More precisely, by the corresponding hex 24-bit ICAO
address. In this case, the registration number is easy to learn from other
sources: FlightRadar24 made a blog
post
saying that “Spirit Airlines flight NK1833 operated by Airbus A320-232 N604NK is
believed to be the final flight.” But if we want to be strict and not rely on
that piece of information published by FlightRadar24, we can find the trace from
the flight number alone. Assuming all we know is the flight
number,
Spirit 1833, we can just (very inefficiently) search inside the trace files for
NKS1833.
# jsons under `traces/` are actually gzips, we suffix with `.gz` so `gzip`
# doesn't get confused and ignores them
find traces -type f -name '*.json' -exec rename -v '.json' '.json.gz' {} +
# super inefficient way of looking for flight number
for trace_last_byte in traces/*; do
    rg --no-heading -H --search-zip 'NKS1833' ${trace_last_byte}/*json.gz
done | cut -d ':' -f 1 | sort | uniq
# and we get a single file with hits: traces/51/trace_full_a7d751.json.gz
That gives one matching trace file, traces/51/trace_full_a7d751.json.gz. That
a7d751 (index 51 is just last two digits) is the 24-bit ICAO hex code. You
can look it up given the registration number of the aircraft on
hexdb.io for example. This is what that trace file looks
like, using readsb’s format:
{
  "icao": "a7d751",
  "r": "N604NK",
  "t": "A320",
  "dbFlags": 0,
  "desc": "AIRBUS A-320",
  "ownOp": "BANK OF UTAH TRUSTEE",
  "version": "readsb 3.16.6 b985831",
  "timestamp": 1777680000.000,
  "trace": [
    [7275.38, 42.224730, -83.349886, "ground", 0.0, 146.2, 1, null, {"type":"adsb_icao","flight":"NKS1833 ","track":146.25,"true_heading":146.25,"squawk":"4123","emergency":"none","category":"A3","nic":8,"rc":186,"version":0,"nac_p":8,"sil":2,"sil_type":"perhour"},"adsb_icao",null,null,null,null],
    ...
    [18507.45, 32.869139, -97.026261, 625, 149.0, 0.0, 0, -704, null, "adsb_icao", 700, null, null, null],
    ...
  ]
}
The fourth number in that "trace" sequence is the altitude in ft (or
“ground” or null). The first number is the number of seconds (7275.38) after
the timestamp (1777680000.000) above. So we have our time and latitude, and more
data fields too like heading, etc.
Then we can just ask an LLM to write a small parser that turns the nested JSON into a cleaner flat table.
Syncing flight data and Geiger counter data
The date/time on the counter was off, but I took a few pictures of it while in flight, with the time visibly displayed.
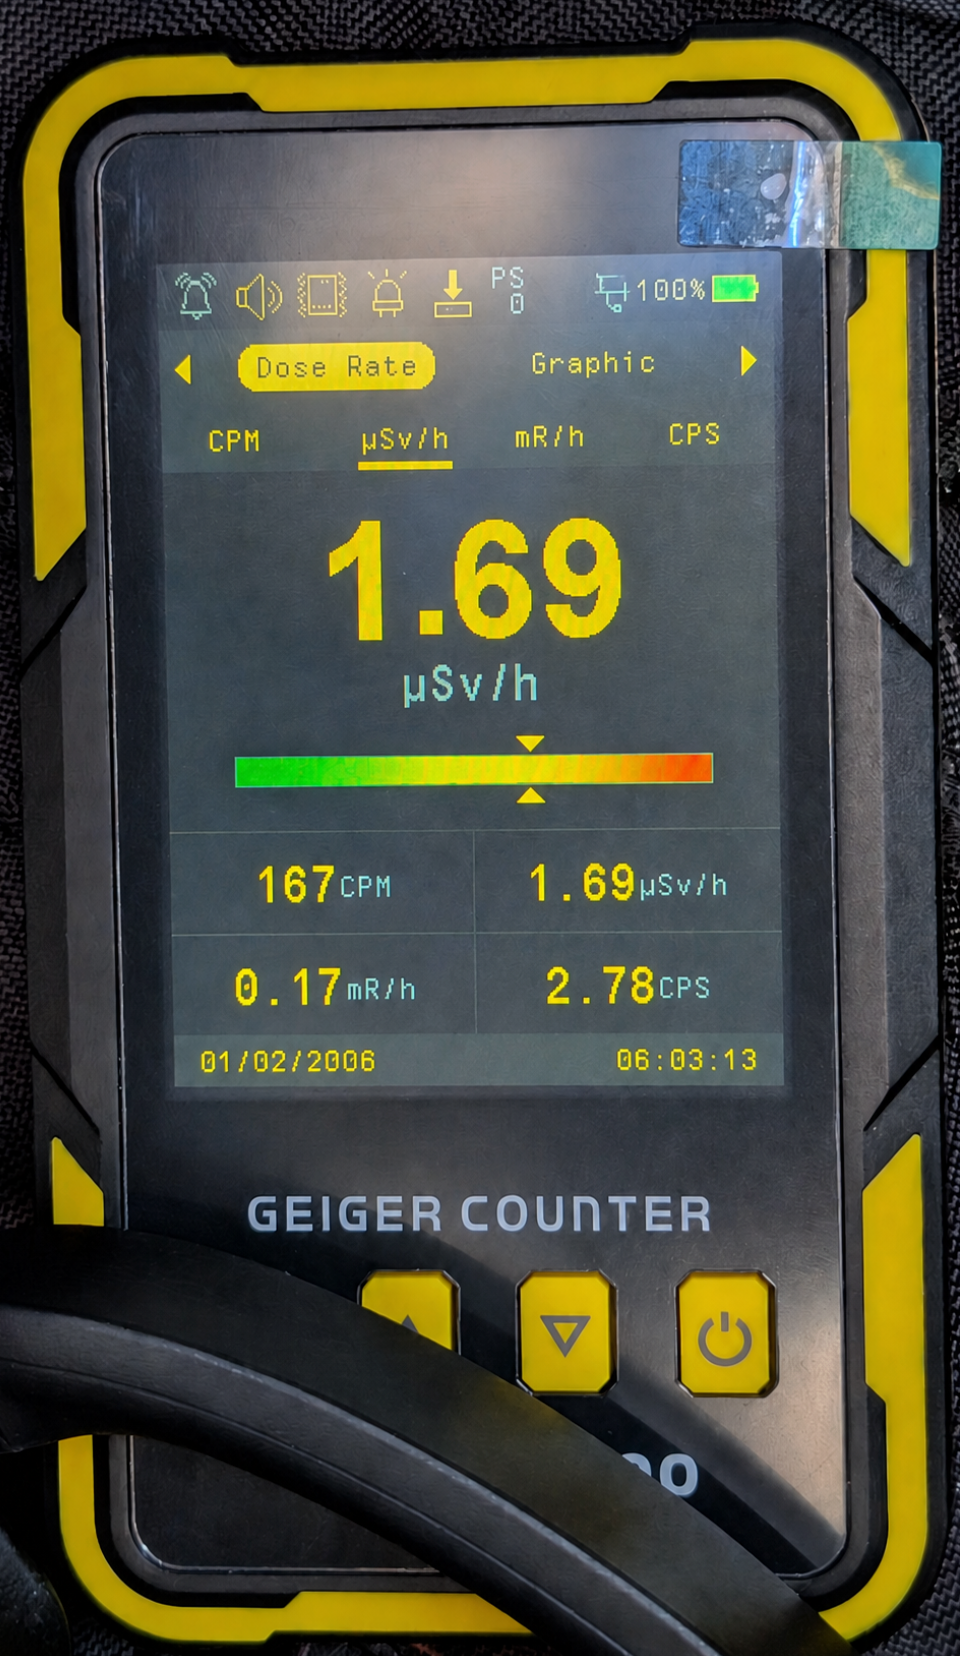
I asked my agent to create a simple table with the time the Geiger counter thought it was, and the time it actually was from EXIF date/time data my phone left in the JPEGs. After some prodding, the agent delivered. It created a table like this:
photo,exif_time,displayed_time,delta_display_minus_exif
PHONE_20060102_092347092.jpg,2006-01-02 10:23:47.092 +01:00,2006-01-02 05:23:42,-05:00:05.092
PHONE_20060102_100017748.jpg,2006-01-02 11:00:17.748 +01:00,2006-01-02 06:00:13,-05:00:04.748
PHONE_20060102_100317892.jpg,2006-01-02 11:03:17.892 +01:00,2006-01-02 06:03:13,-05:00:04.892
PHONE_20060102_101639351.jpg,2006-01-02 11:16:39.351 +01:00,,n/a
PHONE_20060102_102834213.jpg,2006-01-02 11:28:34.213 +01:00,,n/a
PHONE_20060102_190038525.jpg,2006-01-02 20:00:38.525 +01:00,2006-01-02 15:00:36,-05:00:02.525
There was a bit of drift, as in the counter clock was a little fast. But negligible. We can now adjust, and by we, I mean codex / claude / etc.
-
Again, the Geiger counter here doesn’t detect alpha particles, neutrons, etc. So, it does not detect all radiation. ↩︎ ↩︎ ↩︎
-
Contains information from the ADSB.lol historical archive, available under the Open Database License 1.0. ↩︎ ↩︎
-
It is almost surely possible to identify the exact flight from the information on the plots. And I don’t really care that much. Would be interesting to think about differential privacy here, some other time! ↩︎
-
Used AI to remove glare and alter date for privacy. ↩︎